
|
Getting your Trinity Audio player ready...
|
- Long liquidations heavily outweigh shorts, showing strong bearish dominance.
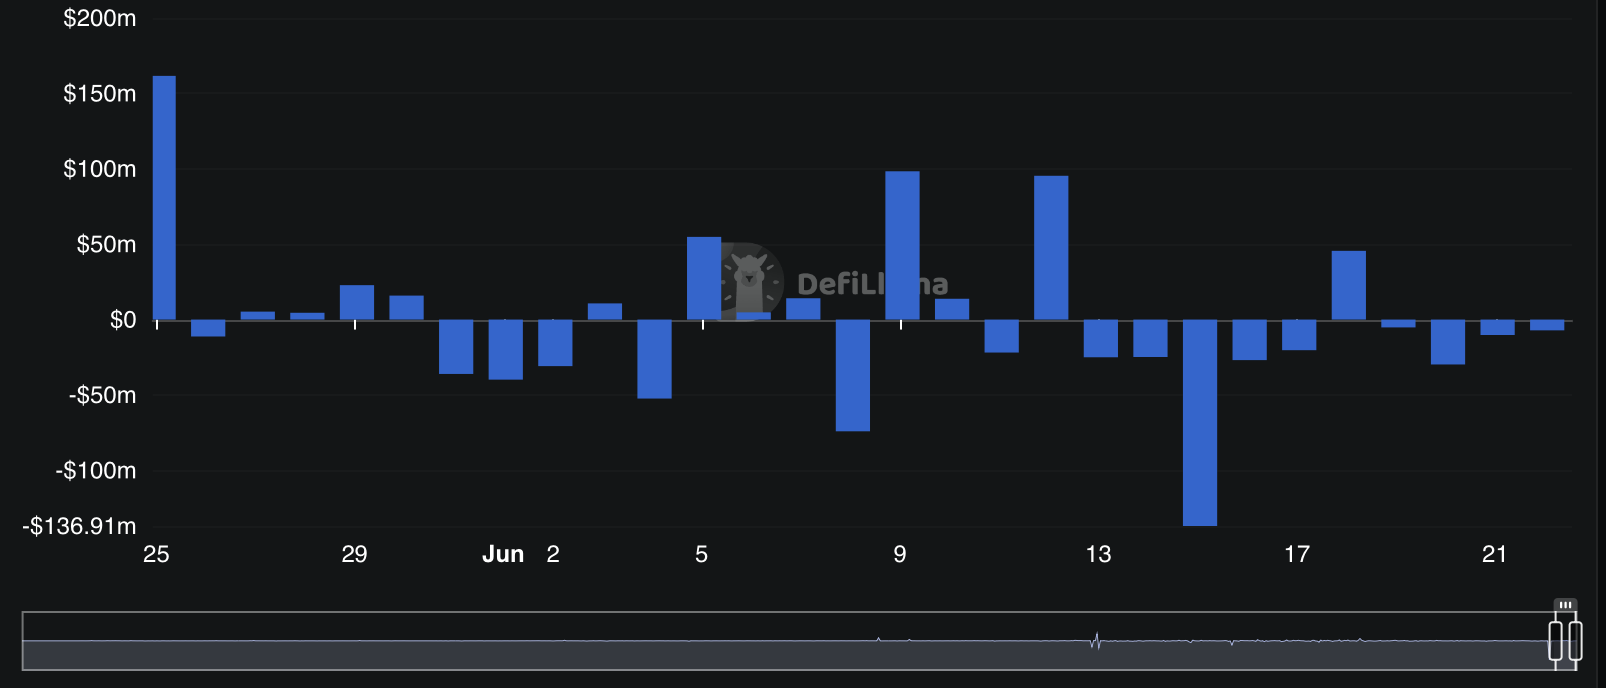
- Over $190M net outflows signal weakening confidence in Arbitrum’s ecosystem.
- ARB is testing key support, with downside risk toward $0.073 if pressure continues.
Arbitrum’s ARB token is under renewed stress as broader crypto market weakness accelerates downside momentum. The asset has fallen sharply in recent sessions, extending its long-term decline to roughly 96% below its peak. Both derivatives data and on-chain activity now point to sustained bearish sentiment, raising concerns that ARB could soon test new lows if selling pressure continues to build.
Liquidation Imbalance Signals Strong Bearish Control
Recent derivatives activity shows a clear imbalance between bullish and bearish traders. Long positions were overwhelmingly liquidated, losing around $750,000 in a single 24-hour window, while short liquidations remained minimal in comparison.
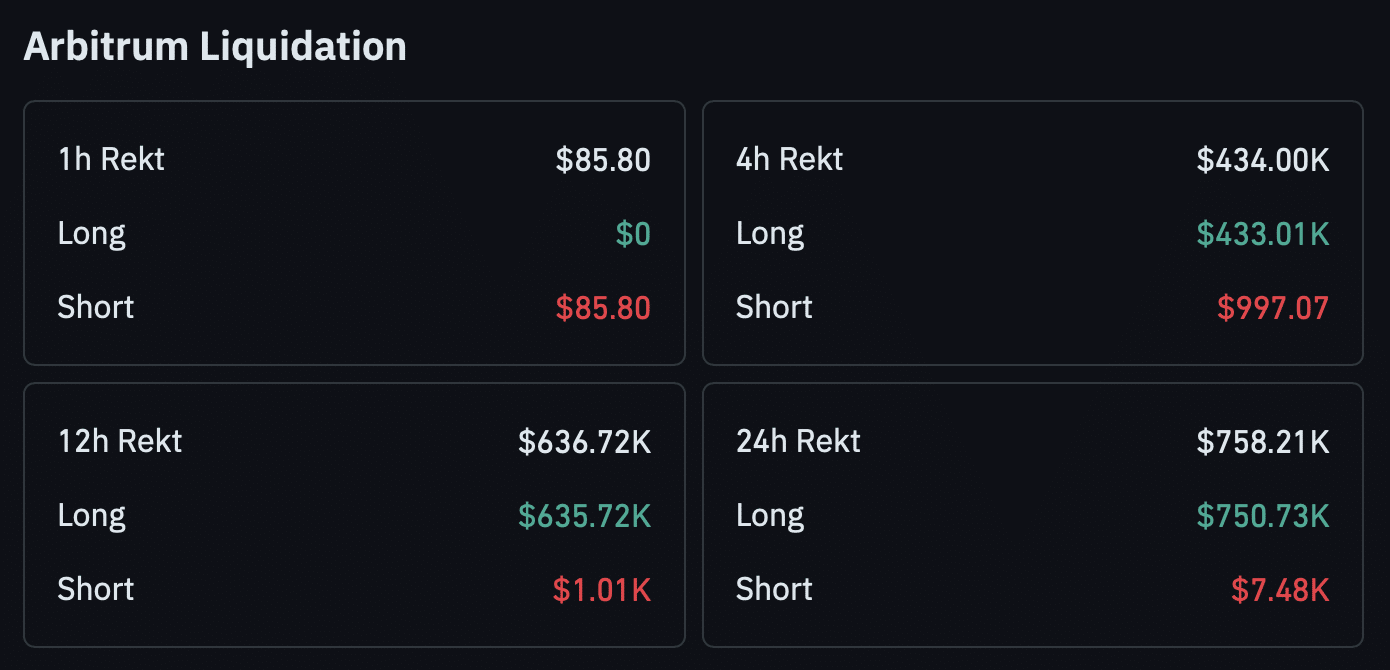
This sharp divergence suggests that most leveraged traders were positioned for a rebound that never materialized. Instead, price action moved decisively against bullish bets, forcing widespread exits. In contrast, short traders faced only minor losses, reinforcing the idea that downward momentum currently dominates market structure.
Despite this, liquidation maps indicate some potential upside liquidity pockets above current levels. These could attract short-term rebounds, but the broader trend still favors further downside pressure.
On-Chain Outflows Weaken Arbitrum Sentiment
On-chain data for Arbitrum paints an equally cautious picture. Stablecoin movement across the network has turned negative, with significantly more capital leaving the ecosystem than entering it since mid-June.
Outflows have reached hundreds of millions of dollars, while inflows have slowed sharply. This sustained drain often signals reduced user engagement or capital rotation toward competing ecosystems. At the same time, total value locked has remained largely unchanged, suggesting that existing liquidity is hesitant to deploy rather than actively accumulating or exiting in force.
Together, these trends point to a market in pause mode, with participants waiting for clearer direction before committing new capital.
ARB Price Tests Key Support Zone
On the chart, ARB is now approaching a historically significant support area that previously triggered multiple rebounds. However, current indicators suggest that this level may not hold as easily this time.
Accumulation metrics show steady distribution, with holders gradually offloading positions into weakness. Trading volume has also risen on downswings, confirming that sellers remain in control.
If the support fails, ARB could drift toward the $0.073 region, a level last seen in early June. While a bounce remains possible due to historical demand zones, momentum indicators suggest the path of least resistance is still downward in the short term.
Also Read: Arbitrum RWA Market Explodes 3X as Ethereum Supply Crunch Builds
ARB’s outlook remains fragile as bearish derivatives positioning, weakening on-chain flows, and persistent selling pressure converge. While technical support may offer temporary relief, the broader trend continues to favor caution. Unless inflows return and liquidation pressure stabilizes, Arbitrum risks extending its decline into deeper support levels in the near term.
Disclaimer: The information in this article is for general purposes only and does not constitute financial advice. The author’s views are personal and may not reflect the views of Chain Affairs. Before making any investment decisions, you should always conduct your own research. Chain Affairs is not responsible for any financial losses.
I’m your translator between the financial Old World and the new frontier of crypto. After a career demystifying economics and markets, I enjoy elucidating crypto – from investment risks to earth-shaking potential. Let’s explore!