|
Getting your Trinity Audio player ready...
|
- HBAR remains trapped in a descending structure near $0.10 support
- Momentum indicators show weakening demand and rising downside risk
- Volatility is climbing, signaling a larger move may be approaching
Hedera’s price structure is showing clear signs of strain as HBAR trades just above the psychologically important $0.10 level. After several failed rebound attempts, downside pressure is steadily building, leaving the market vulnerable to a deeper move if support gives way.
Across both the 4-hour and daily timeframes, sellers are gradually regaining control, while bullish momentum continues to fade.
Short-Term Momentum Weakens
On the 4-hour chart, HBAR remains locked inside a descending structure. While the MACD still shows the faster moving average marginally above the slower one, momentum is clearly deteriorating. The histogram is contracting, suggesting that the recent recovery attempt is losing steam and may soon roll over.
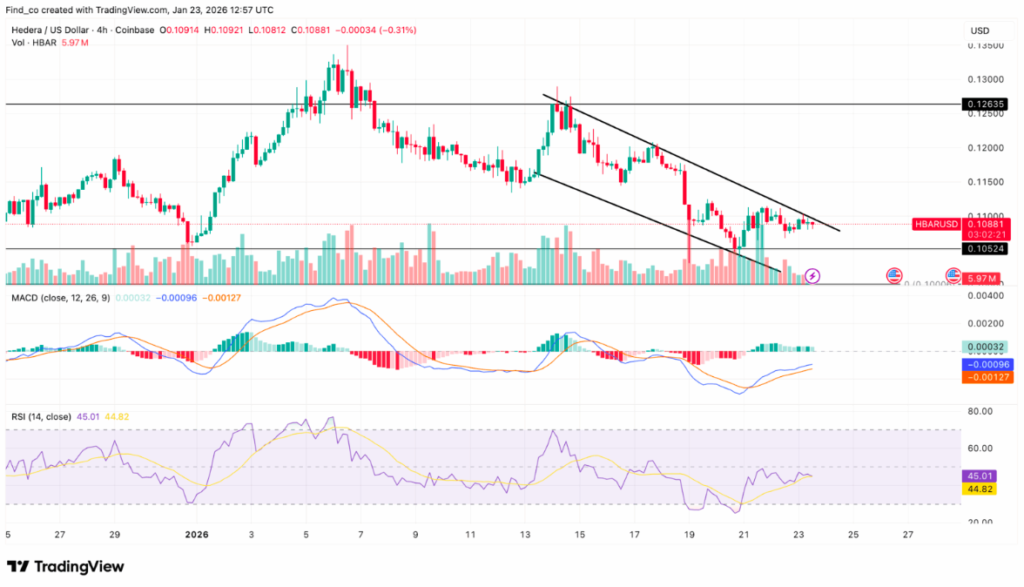
The Relative Strength Index reinforces this picture. RSI has slipped below the neutral 50 level and now hovers in the low-40s, reflecting declining buying interest and a more defensive market posture.
Price action remains compressed beneath a downward-sloping trendline, with HBAR drifting closer to the lower boundary of its range. The $0.10 zone now acts as the critical short-term pivot. A decisive breakdown, especially on rising volume, could open the door toward the $0.095 area and expose lower supports shortly after.
Volatility Signals Growing Tension
While price action remains muted, volatility is quietly picking up. One-month annualized realized volatility has climbed back into the mid-60% range, marking a clear shift from the calmer conditions seen earlier this month.
This divergence — rising volatility alongside soft or declining prices — often reflects mounting uncertainty and positioning pressure beneath the surface. Rather than signaling an immediate breakout, it suggests the market is coiling for a more forceful move.
Daily Structure Keeps Bears in Control
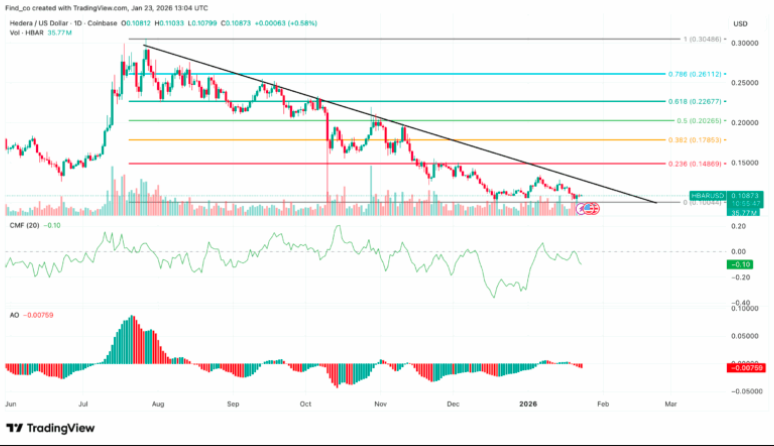
On the daily chart, the broader trend remains intact. HBAR continues to print lower highs and lower lows within a descending channel, reinforcing the bearish bias.
Capital flows offer little encouragement. The Chaikin Money Flow indicator remains firmly negative, pointing to persistent outflows and weak accumulation. Meanwhile, the Awesome Oscillator has flipped red, confirming that bearish momentum is expanding rather than stabilizing.
From a Fibonacci perspective, downside targets remain clearly defined. With HBAR hovering near $0.11, the path of least resistance still leads toward $0.10, with $0.085 emerging as a deeper downside level if selling accelerates.
A meaningful recovery would require buyers to reclaim key resistance and flip momentum decisively. Until then, HBAR’s price action remains fragile.
Disclaimer: The information in this article is for general purposes only and does not constitute financial advice. The author’s views are personal and may not reflect the views of Chain Affairs. Before making any investment decisions, you should always conduct your own research. Chain Affairs is not responsible for any financial losses.
I’m your translator between the financial Old World and the new frontier of crypto. After a career demystifying economics and markets, I enjoy elucidating crypto – from investment risks to earth-shaking potential. Let’s explore!