|
Getting your Trinity Audio player ready...
|
Key Takeaways
- Whale accumulation has been the primary catalyst behind HBAR’s recent price surge.
- Spot and derivatives markets show synchronized bullish sentiment, reinforcing the rally’s strength.
- Technical resistance levels between $0.21–$0.29 will be critical for HBAR’s short-term trajectory.
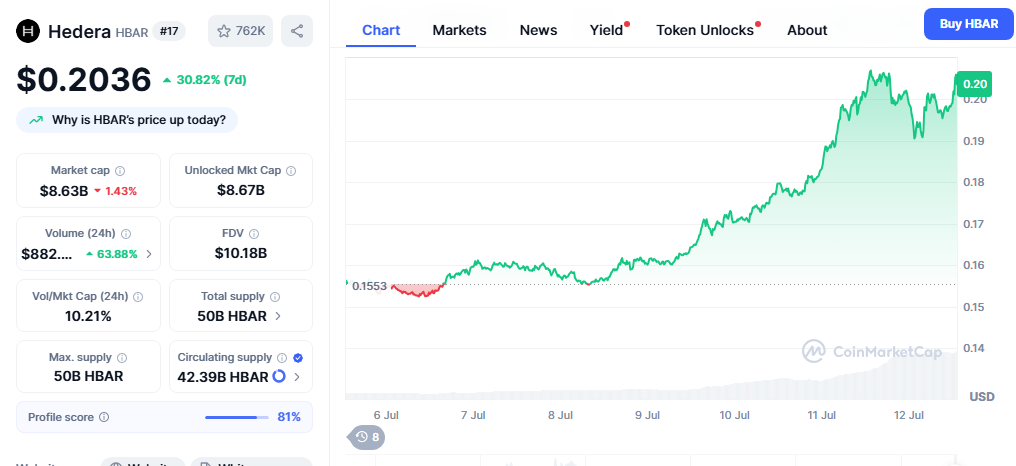
Hedera’s native token HBAR surged over 15% in the last 24 hours, marking one of the strongest performances in the crypto market amid broader uncertainty. This explosive rally places HBAR among the day’s top gainers, driven largely by whale accumulation and strong alignment between spot and derivatives markets.
Whale Accumulation Fuels HBAR’s Breakout
The recent HBAR rally appears to be sparked by a noticeable uptick in whale accumulation. On-chain data from CryptoQuant reveals that major holders began aggressively buying HBAR shortly after Bitcoin’s bullish reversal. Historically, such whale behavior has often preceded strong upward price action, and this time appears no different.
The accumulation trend signals growing confidence among high-cap investors, often seen as a bullish indicator for broader retail sentiment. With whales entering the market, momentum quickly followed, igniting a rush of buying activity across major exchanges.
Spot and Futures Markets Signal Unified Bullishness
HBAR’s bullish trajectory is further confirmed by rising activity in both spot and futures markets. On the spot side, buyers have consistently outpaced sellers, even as prices climbed—indicating strong demand and a reluctance to sell.
Meanwhile, futures trading volumes have spiked, with long positions dominating. This harmony between spot and derivatives markets reflects a unified market belief in HBAR’s continued upside. Such alignment often strengthens rally potential and minimizes near-term volatility.
Technical Resistance Ahead: Can HBAR Break Through?
Technically, HBAR faces its next major test between the $0.21 and $0.29 resistance zones—levels that previously triggered rejections during periods of price consolidation. However, this time the token has broken out from a triangle pattern, increasing the probability of sustained bullish momentum.

Indicators like RSI and MACD are turning positive, though short-term investors may still pose a risk by locking in profits. Any spike in sell pressure could temporarily stall the rally, making the coming days crucial for price direction.
Also Read: HBAR Climbs 27% as Hedera Partners with Australia’s Central Bank on Digital Asset Pilot
As network usage and market participation increase, HBAR appears primed for continued upward movement. Key resistance levels will determine whether the rally matures into a full breakout, but for now, bullish signals dominate.
Disclaimer: The information in this article is for general purposes only and does not constitute financial advice. The author’s views are personal and may not reflect the views of Chain Affairs. Before making any investment decisions, you should always conduct your own research. Chain Affairs is not responsible for any financial losses.
I’m your translator between the financial Old World and the new frontier of crypto. After a career demystifying economics and markets, I enjoy elucidating crypto – from investment risks to earth-shaking potential. Let’s explore!