|
Getting your Trinity Audio player ready...
|
Bitcoin Cash (BCH) has been on a downward trajectory since reaching its cycle high in March 2024. After creating a lower high in December, the decline accelerated, pushing BCH down nearly 50% from its peak. Despite the sell-off, BCH remains above the crucial horizontal support level at $340, a key indicator for future price direction.
BCH Breaks Down From Long-Term Support
A key development in BCH’s price action is the breakdown from an ascending support trend line in early February. This trend line had been intact for 539 days, underscoring its significance. While BCH lost this diagonal support, it managed to prevent a breakdown from the $305 horizontal support area. However, a failed attempt to reclaim the ascending support trend line resulted in a long upper wick, suggesting bearish pressure.
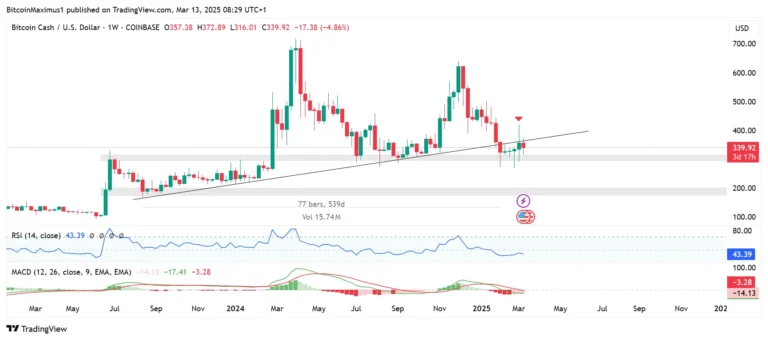
Technical indicators align with this negative outlook. The Relative Strength Index (RSI) is below 50, and the Moving Average Convergence/Divergence (MACD) is negative, both reinforcing the bearish trend. If BCH closes decisively below $305, it could trigger a drop toward the next major support at $195.
Bounce or Breakdown?
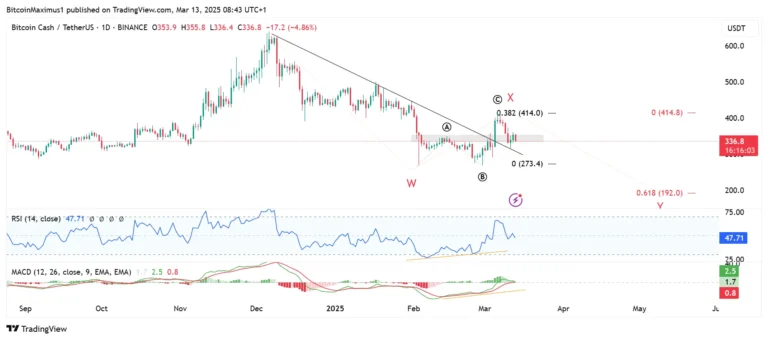
The daily timeframe offers a mixed outlook. BCH recently broke out from a descending resistance trend line after bullish divergences appeared in the RSI and MACD. However, it failed to sustain the rally, getting rejected at the 0.382 Fibonacci retracement resistance level of $414. This pattern suggests a potential continuation of the downtrend.
The price currently hovers around minor support at $440. Losing this level could accelerate the decline. From an Elliott Wave perspective, BCH’s movement aligns with a W-X-Y correction, where wave Y could push prices down to $192, coinciding with long-term support at $195.
Also Read: Ethereum’s ‘Falling Knife’ Plunge: Analysts Warn of Another 30% Drop vs. Bitcoin
Final Verdict: Breakdown Incoming?
While BCH has held above the $340 horizontal support, the failure to reclaim long-term support suggests a bearish trend. A decisive weekly close below $340 could trigger a major downward move, setting the stage for a new yearly low near $195. Conversely, reclaiming the long-term ascending trend line could revive bullish momentum, though this remains the less likely scenario for now.
Disclaimer: The information in this article is for general purposes only and does not constitute financial advice. The author’s views are personal and may not reflect the views of Chain Affairs. Before making any investment decisions, you should always conduct your own research. Chain Affairs is not responsible for any financial losses.
I’m your translator between the financial Old World and the new frontier of crypto. After a career demystifying economics and markets, I enjoy elucidating crypto – from investment risks to earth-shaking potential. Let’s explore!