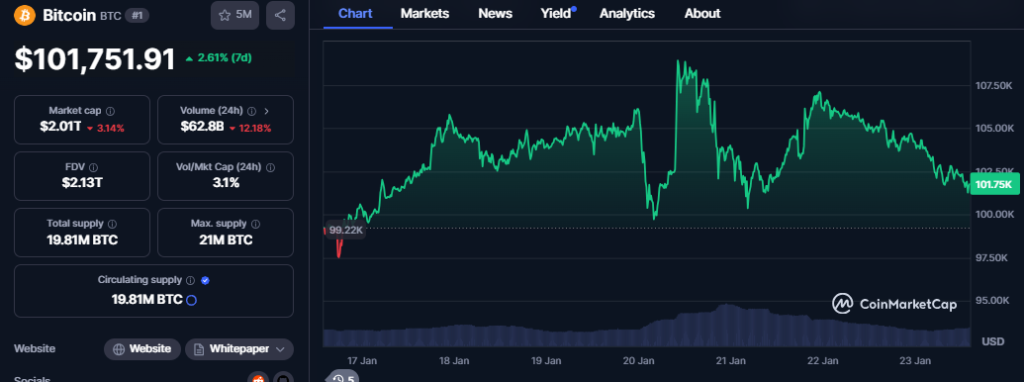
Bitcoin’s (BTC) price closed Wednesday with a black Marubozu candlestick, signaling a growing bearish momentum. After being rejected at a crucial resistance zone between $107k and $109k, Bitcoin formed a short-term reversal pattern that suggests a potential price drop. Traders are now closely monitoring key technical indicators for insights into Bitcoin’s next moves.
Technical Breakdown: Bearish Signals and Support Zones
In the four-hour time frame, Bitcoin’s price is forming a possible head and shoulders (H&S) pattern, a bearish reversal signal. Adding to the pressure is a falling divergence in the Relative Strength Index (RSI), which indicates weakening bullish momentum. Should the bearish sentiment continue, Bitcoin could find support between the $101k and $99.5k range. A break below this zone could pave the way for further downside.
On the daily time frame, a macro reversal pattern has been taking shape since December 2024, marked by a double top formation and bearish divergence. If this trend persists, Bitcoin may drop to the lower border of a horizontal channel around $91k, a critical support level for traders to watch.
Conflicting Market Sentiment
Despite a bullish outlook triggered by pro-crypto US President Donald Trump’s inauguration, Bitcoin’s momentum has cooled. The sell-the-news effect seems to have dampened the market, leaving many traders uncertain about short-term price action. However, long-term investors such as MicroStrategy and BlackRock continue to accumulate Bitcoin, demonstrating confidence in its future prospects. This contrast in sentiment suggests potential volatility ahead.

Economic Events: Uncertainty Looms
Market participants are also keeping an eye on upcoming economic events. The Bank of Japan’s policy rate decision tomorrow could provide clues on how it might influence next week’s Federal Reserve interest rate policy. The unpredictability surrounding the Trump administration, coupled with higher-than-expected inflation, has created an air of uncertainty, making it difficult to predict Bitcoin’s next move.
Also Read: Bitcoin Nears $109K All-Time High: Key Resistance at $106K Holds the Spotlight
As traders navigate this volatile environment, it’s crucial to monitor Bitcoin’s price action and key technical levels for further clues on its future direction.
Disclaimer: The information in this article is for general purposes only and does not constitute financial advice. The author’s views are personal and may not reflect the views of Chain Affairs. Before making any investment decisions, you should always conduct your own research. Chain Affairs is not responsible for any financial losses.


