
|
Getting your Trinity Audio player ready...
|
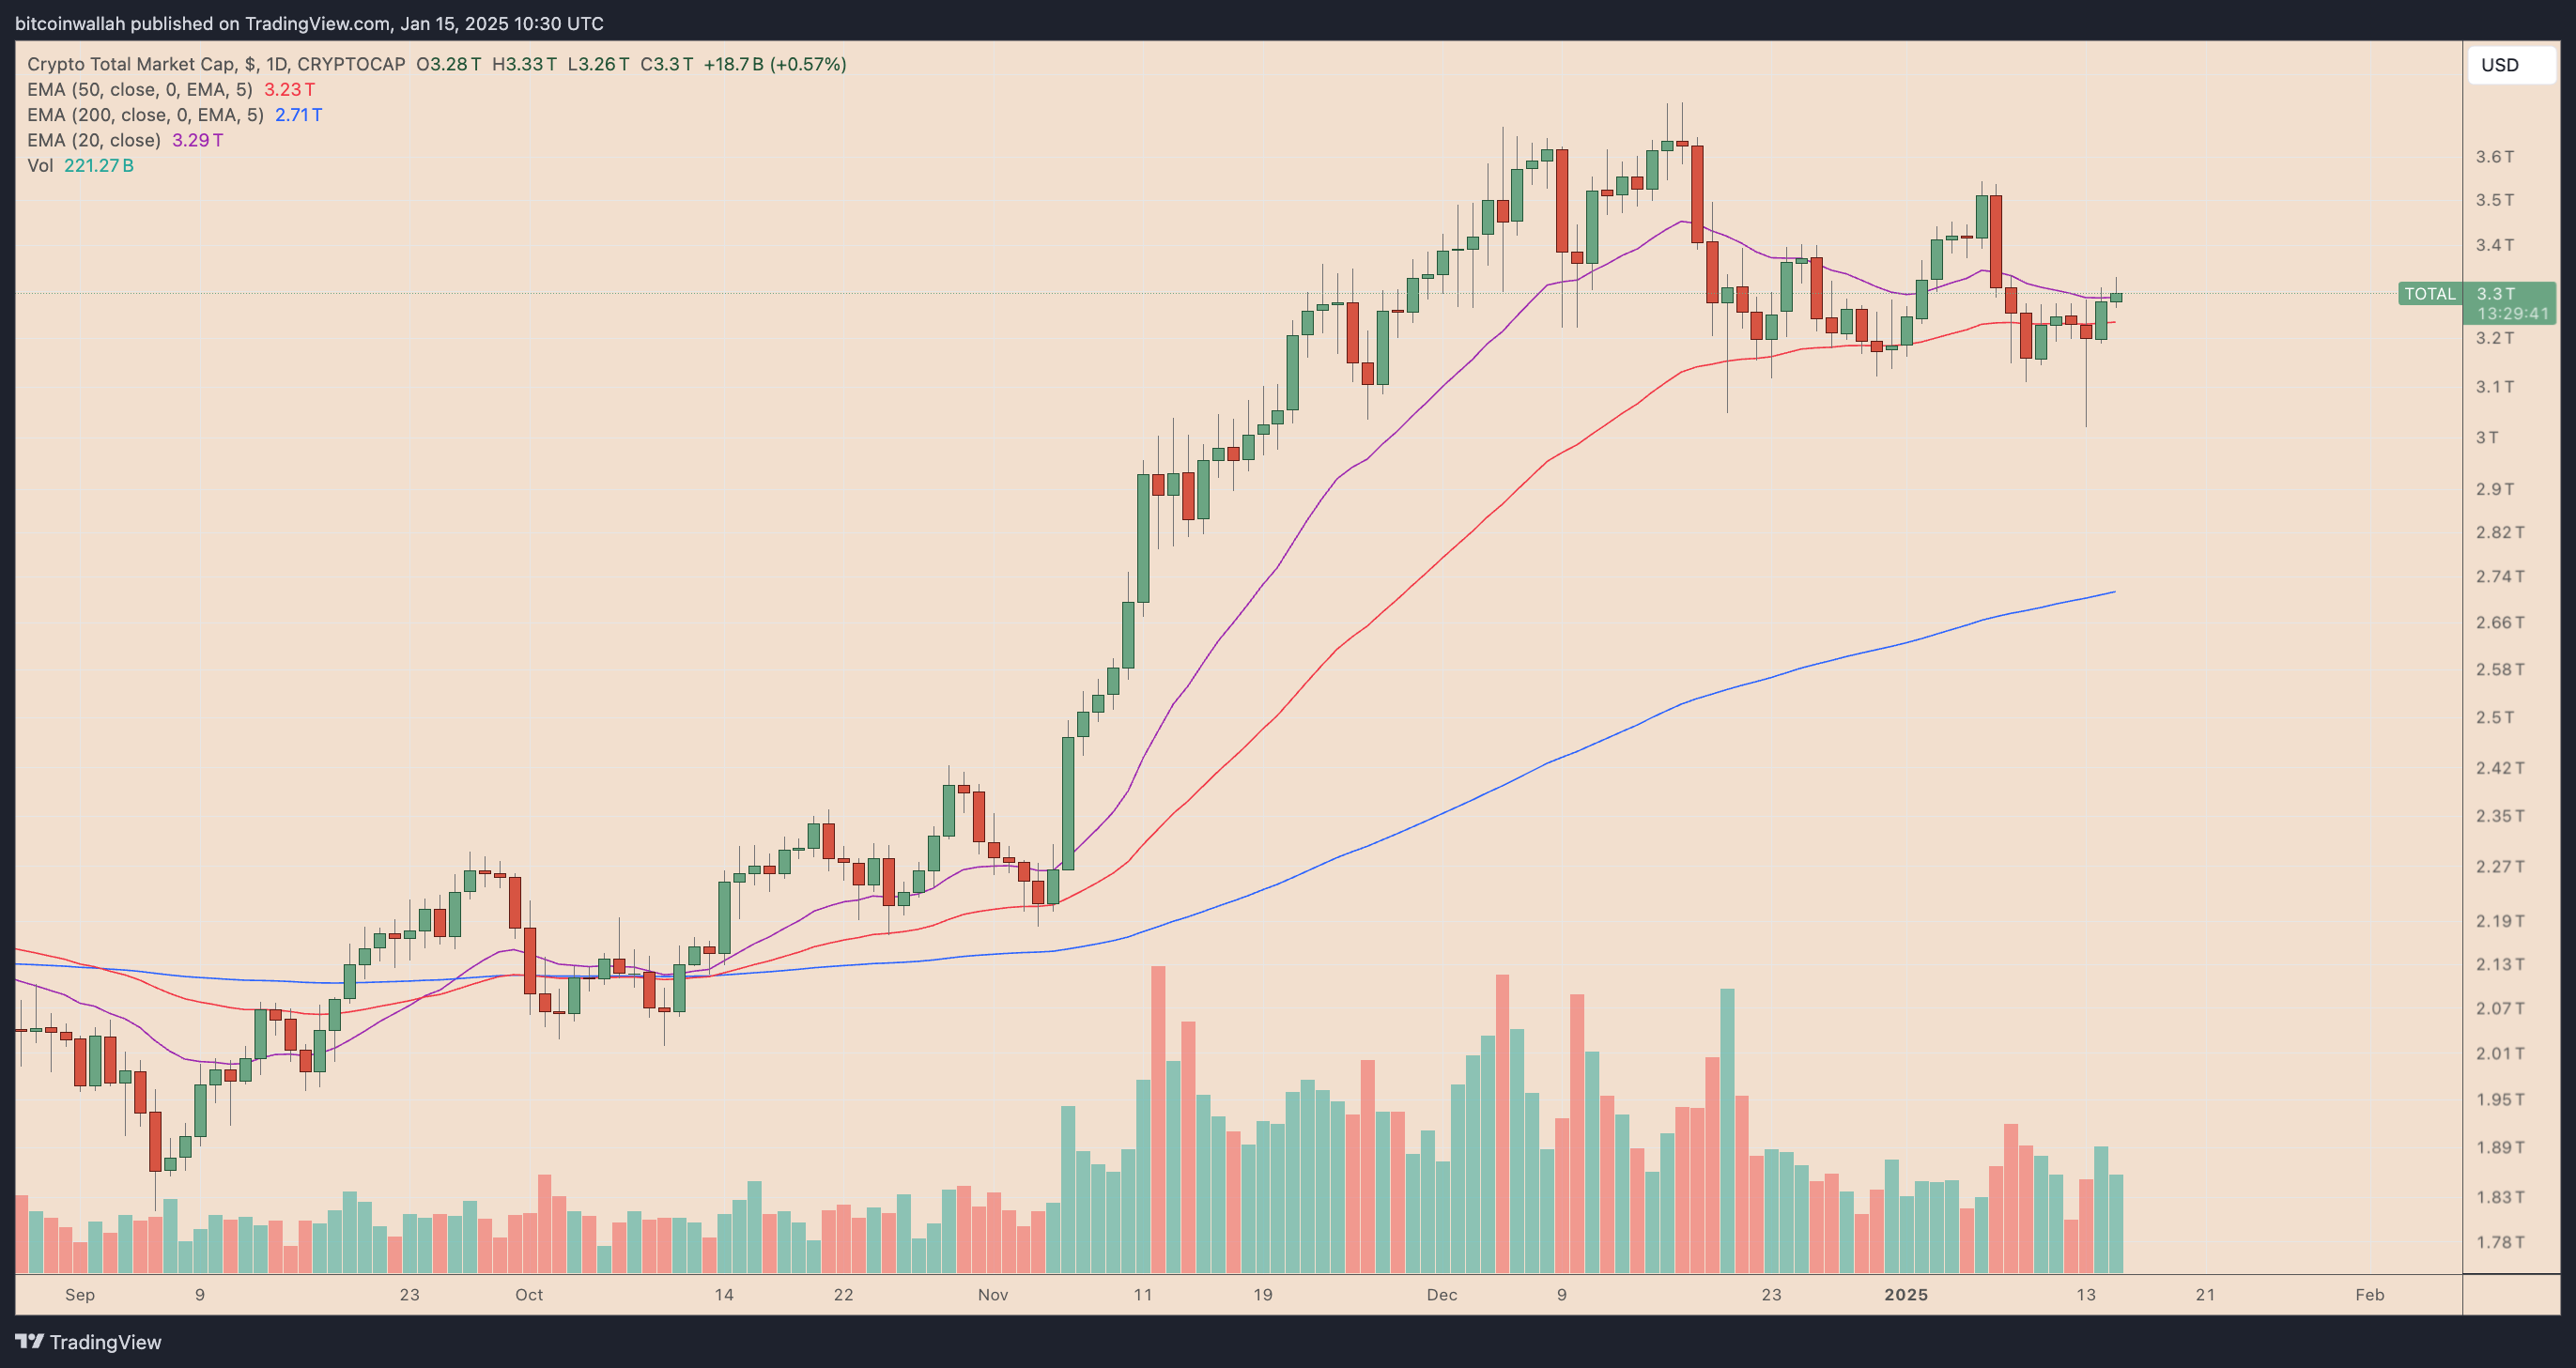
The cryptocurrency market has extended its recovery, driven by optimism surrounding easing inflationary pressures following a favorable U.S. wholesale price report. Among the standout performers are Cardano (ADA), Hedera (HBAR), and Stellar (XLM), each demonstrating notable gains and captivating both traders and long-term investors with compelling technical setups.
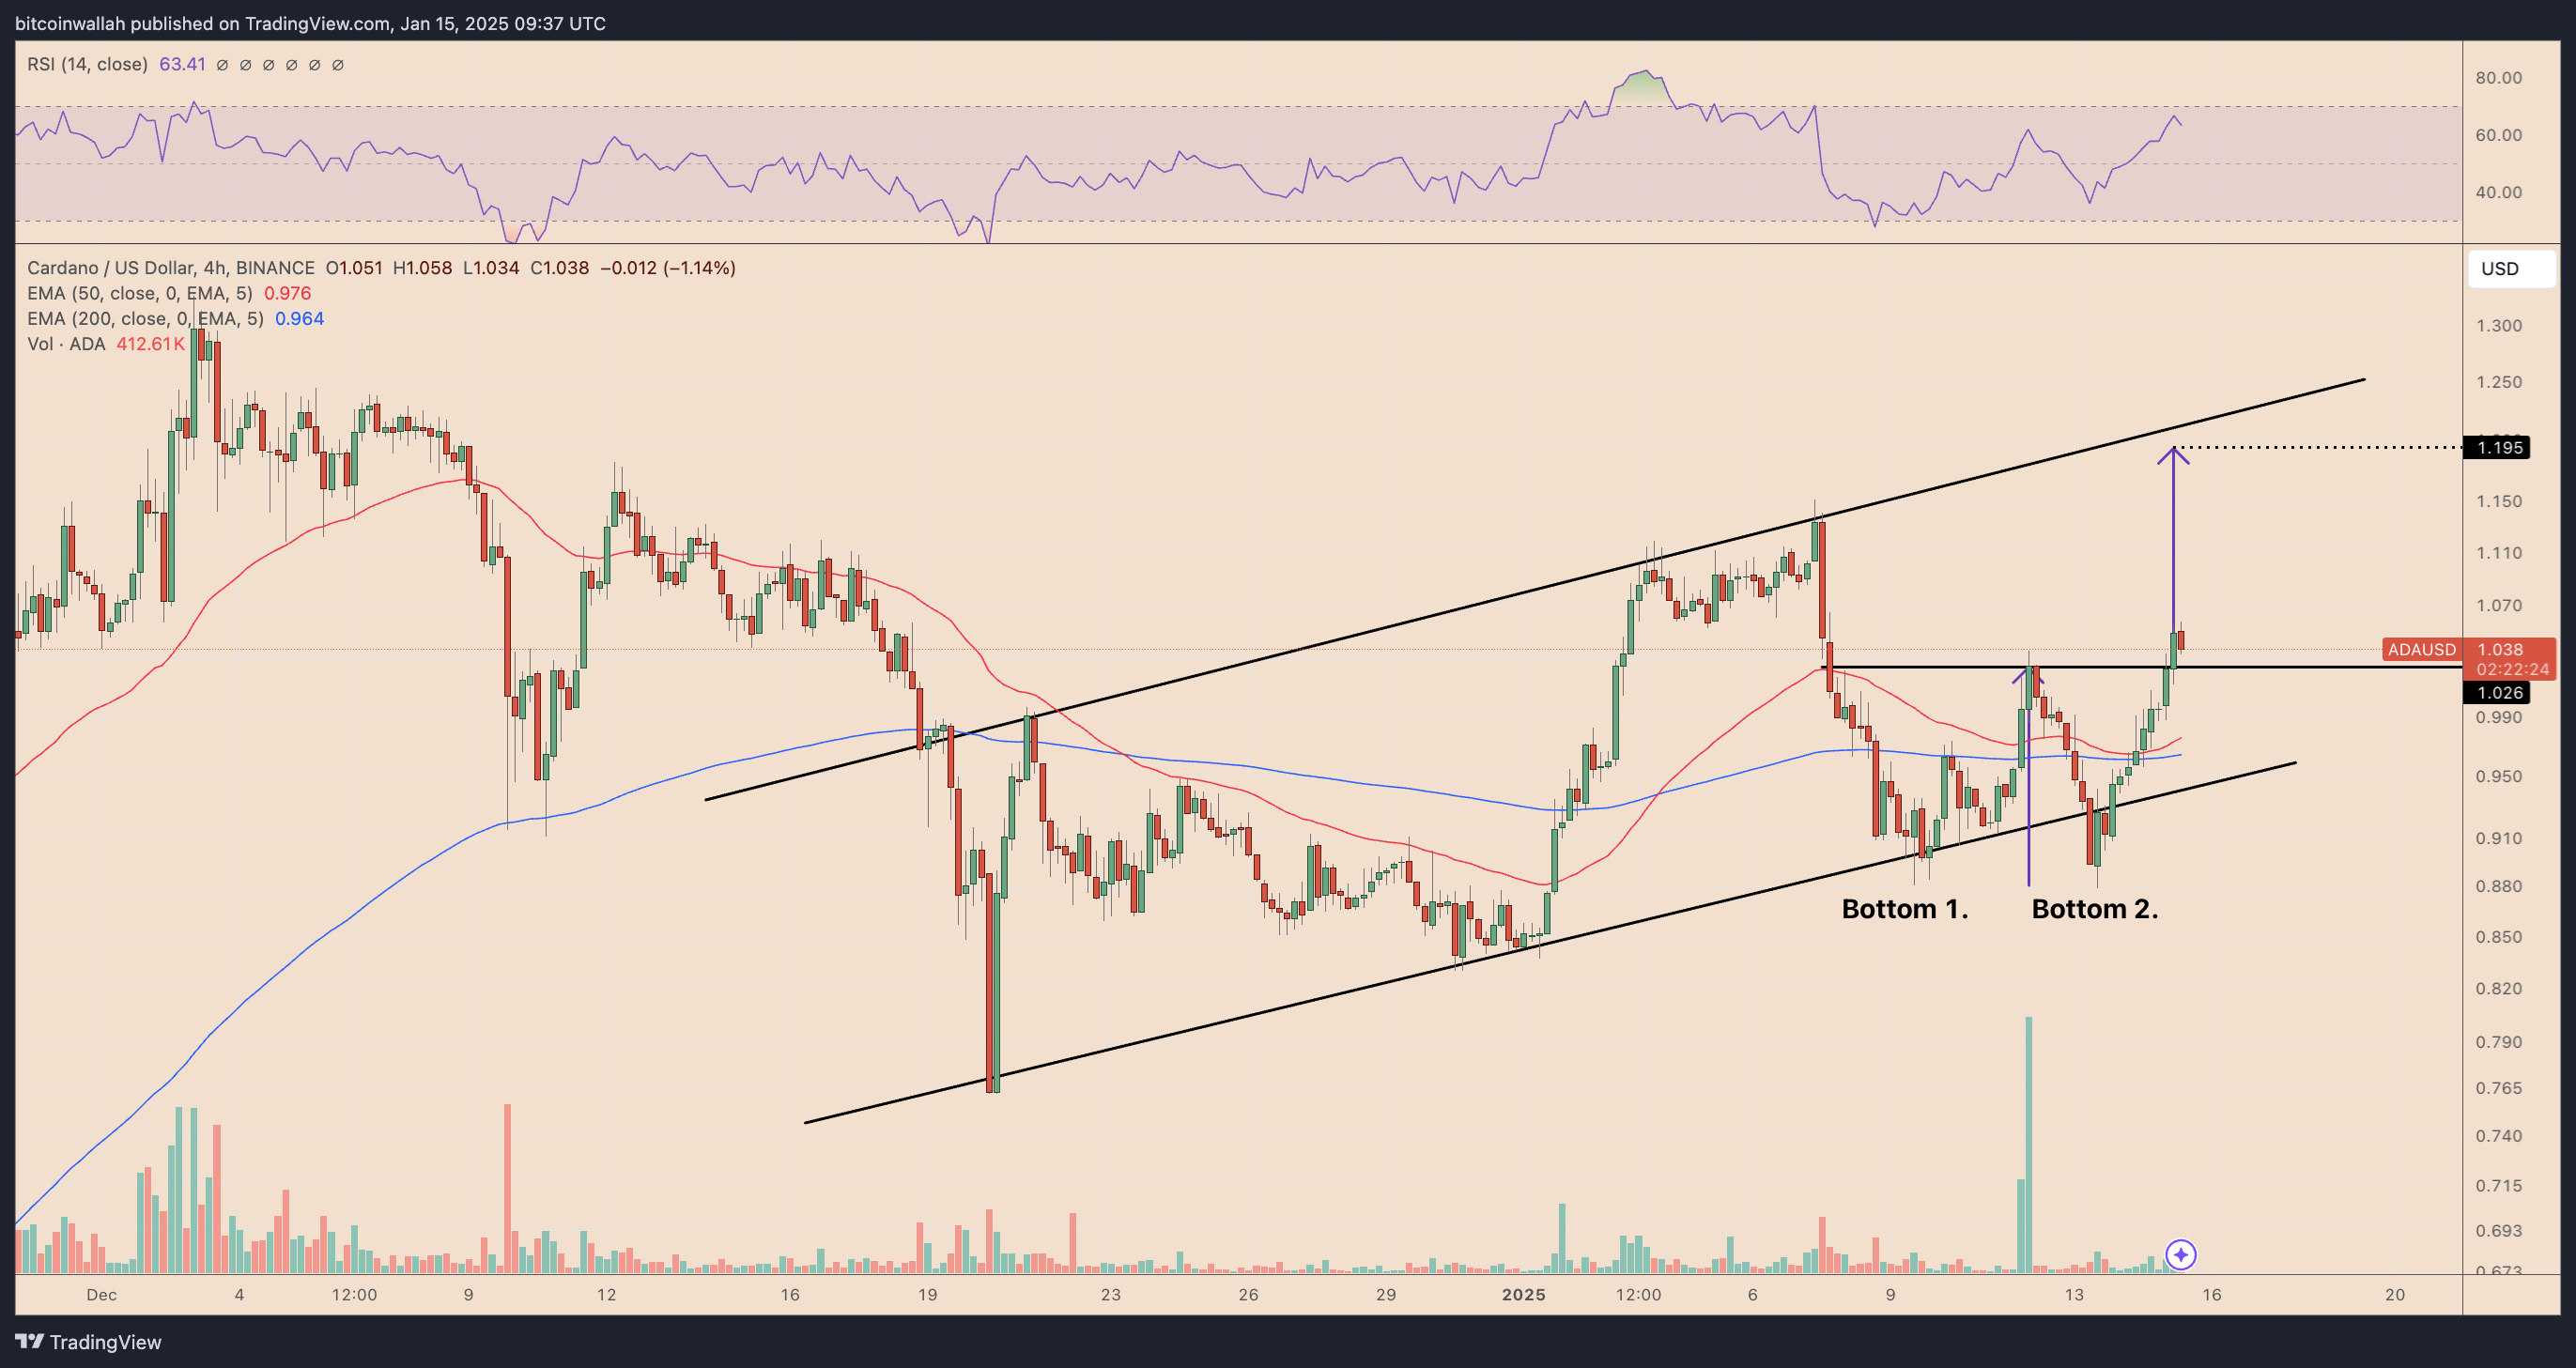
Cardano (ADA): Poised for a Breakout
Cardano has entered a bullish phase, breaking above its $1.026 neckline on a double-bottom pattern. This setup, reinforced by ADA’s position above its 50-EMA on the four-hour chart, signals a potential 15% rally to $1.20. On the weekly chart, a symmetrical triangle pattern suggests even greater upside, with a measured move targeting $1.66—a 65% increase from current levels. However, traders should watch for potential pullbacks if ADA fails to sustain momentum above the neckline.
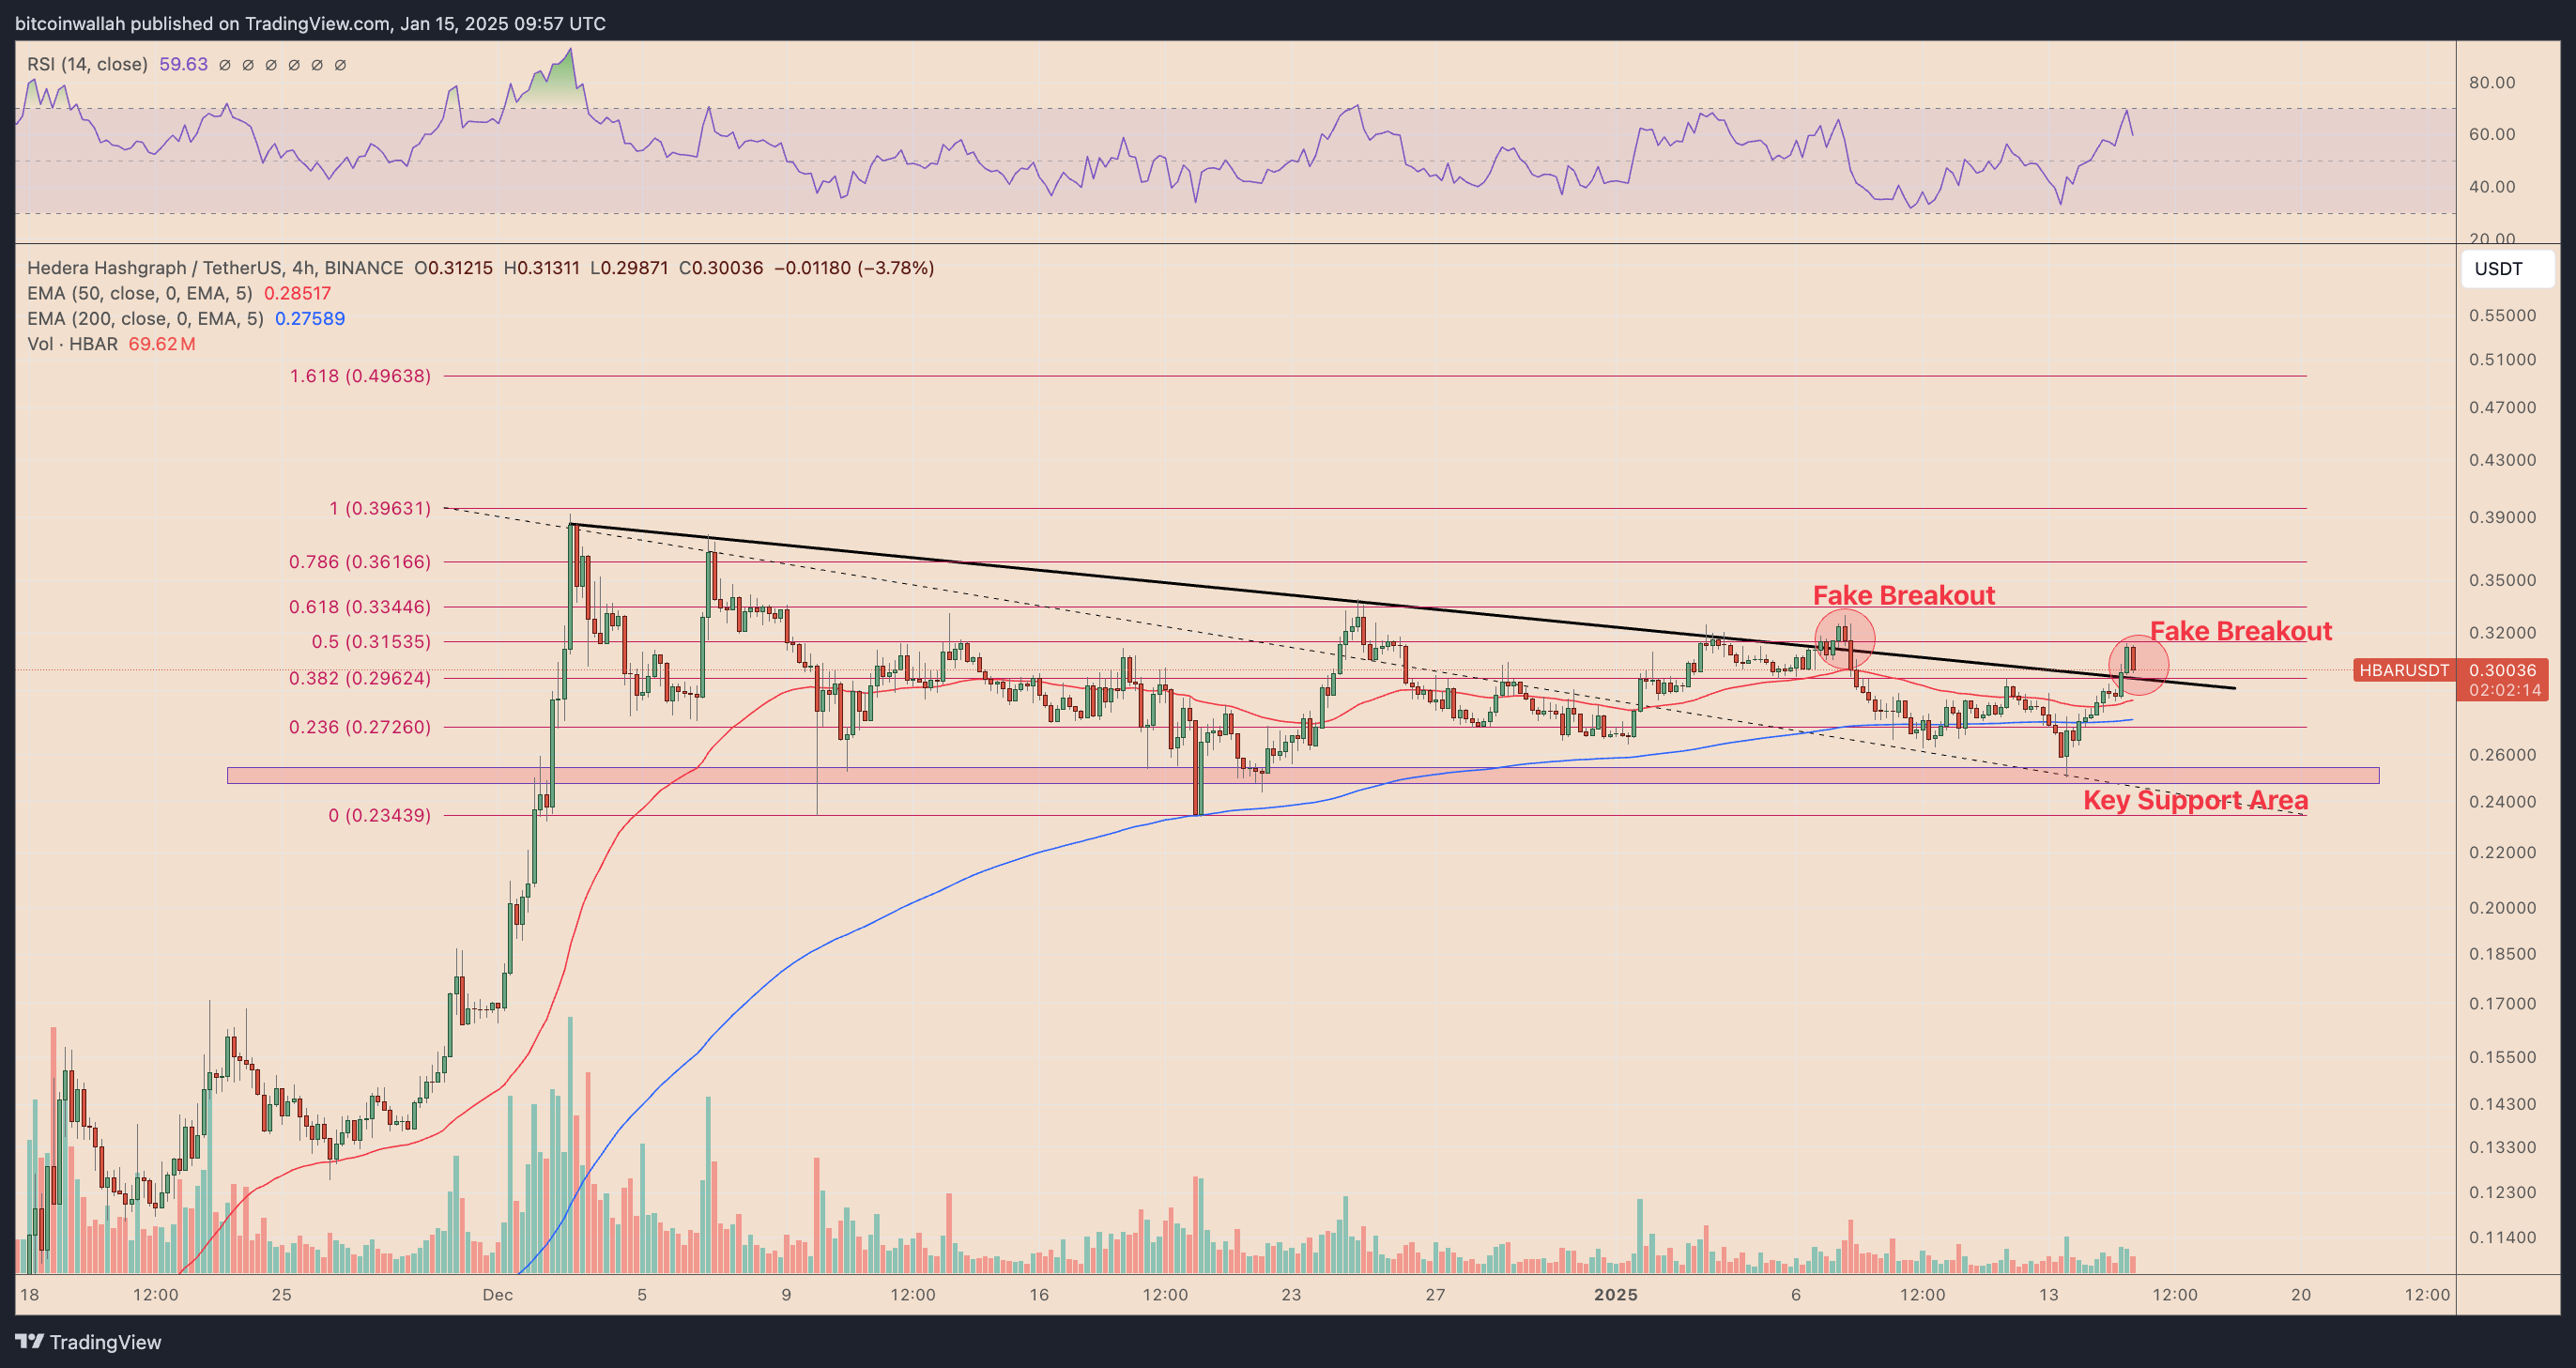
Hedera (HBAR): Vulnerable to Correction
Hedera‘s recent attempt to break above its descending trendline has stalled, highlighting resistance at the 0.5 Fibonacci retracement level near $0.31. Overbought RSI levels on the four-hour chart point to waning bullish momentum. If selling pressure intensifies, HBAR could retrace to the $0.272 support zone, coinciding with its 50-EMA and 200-EMA. A bullish breakout above $0.31 could lead to a rally toward $0.41, but traders must remain cautious of a bearish reversal to $0.19.
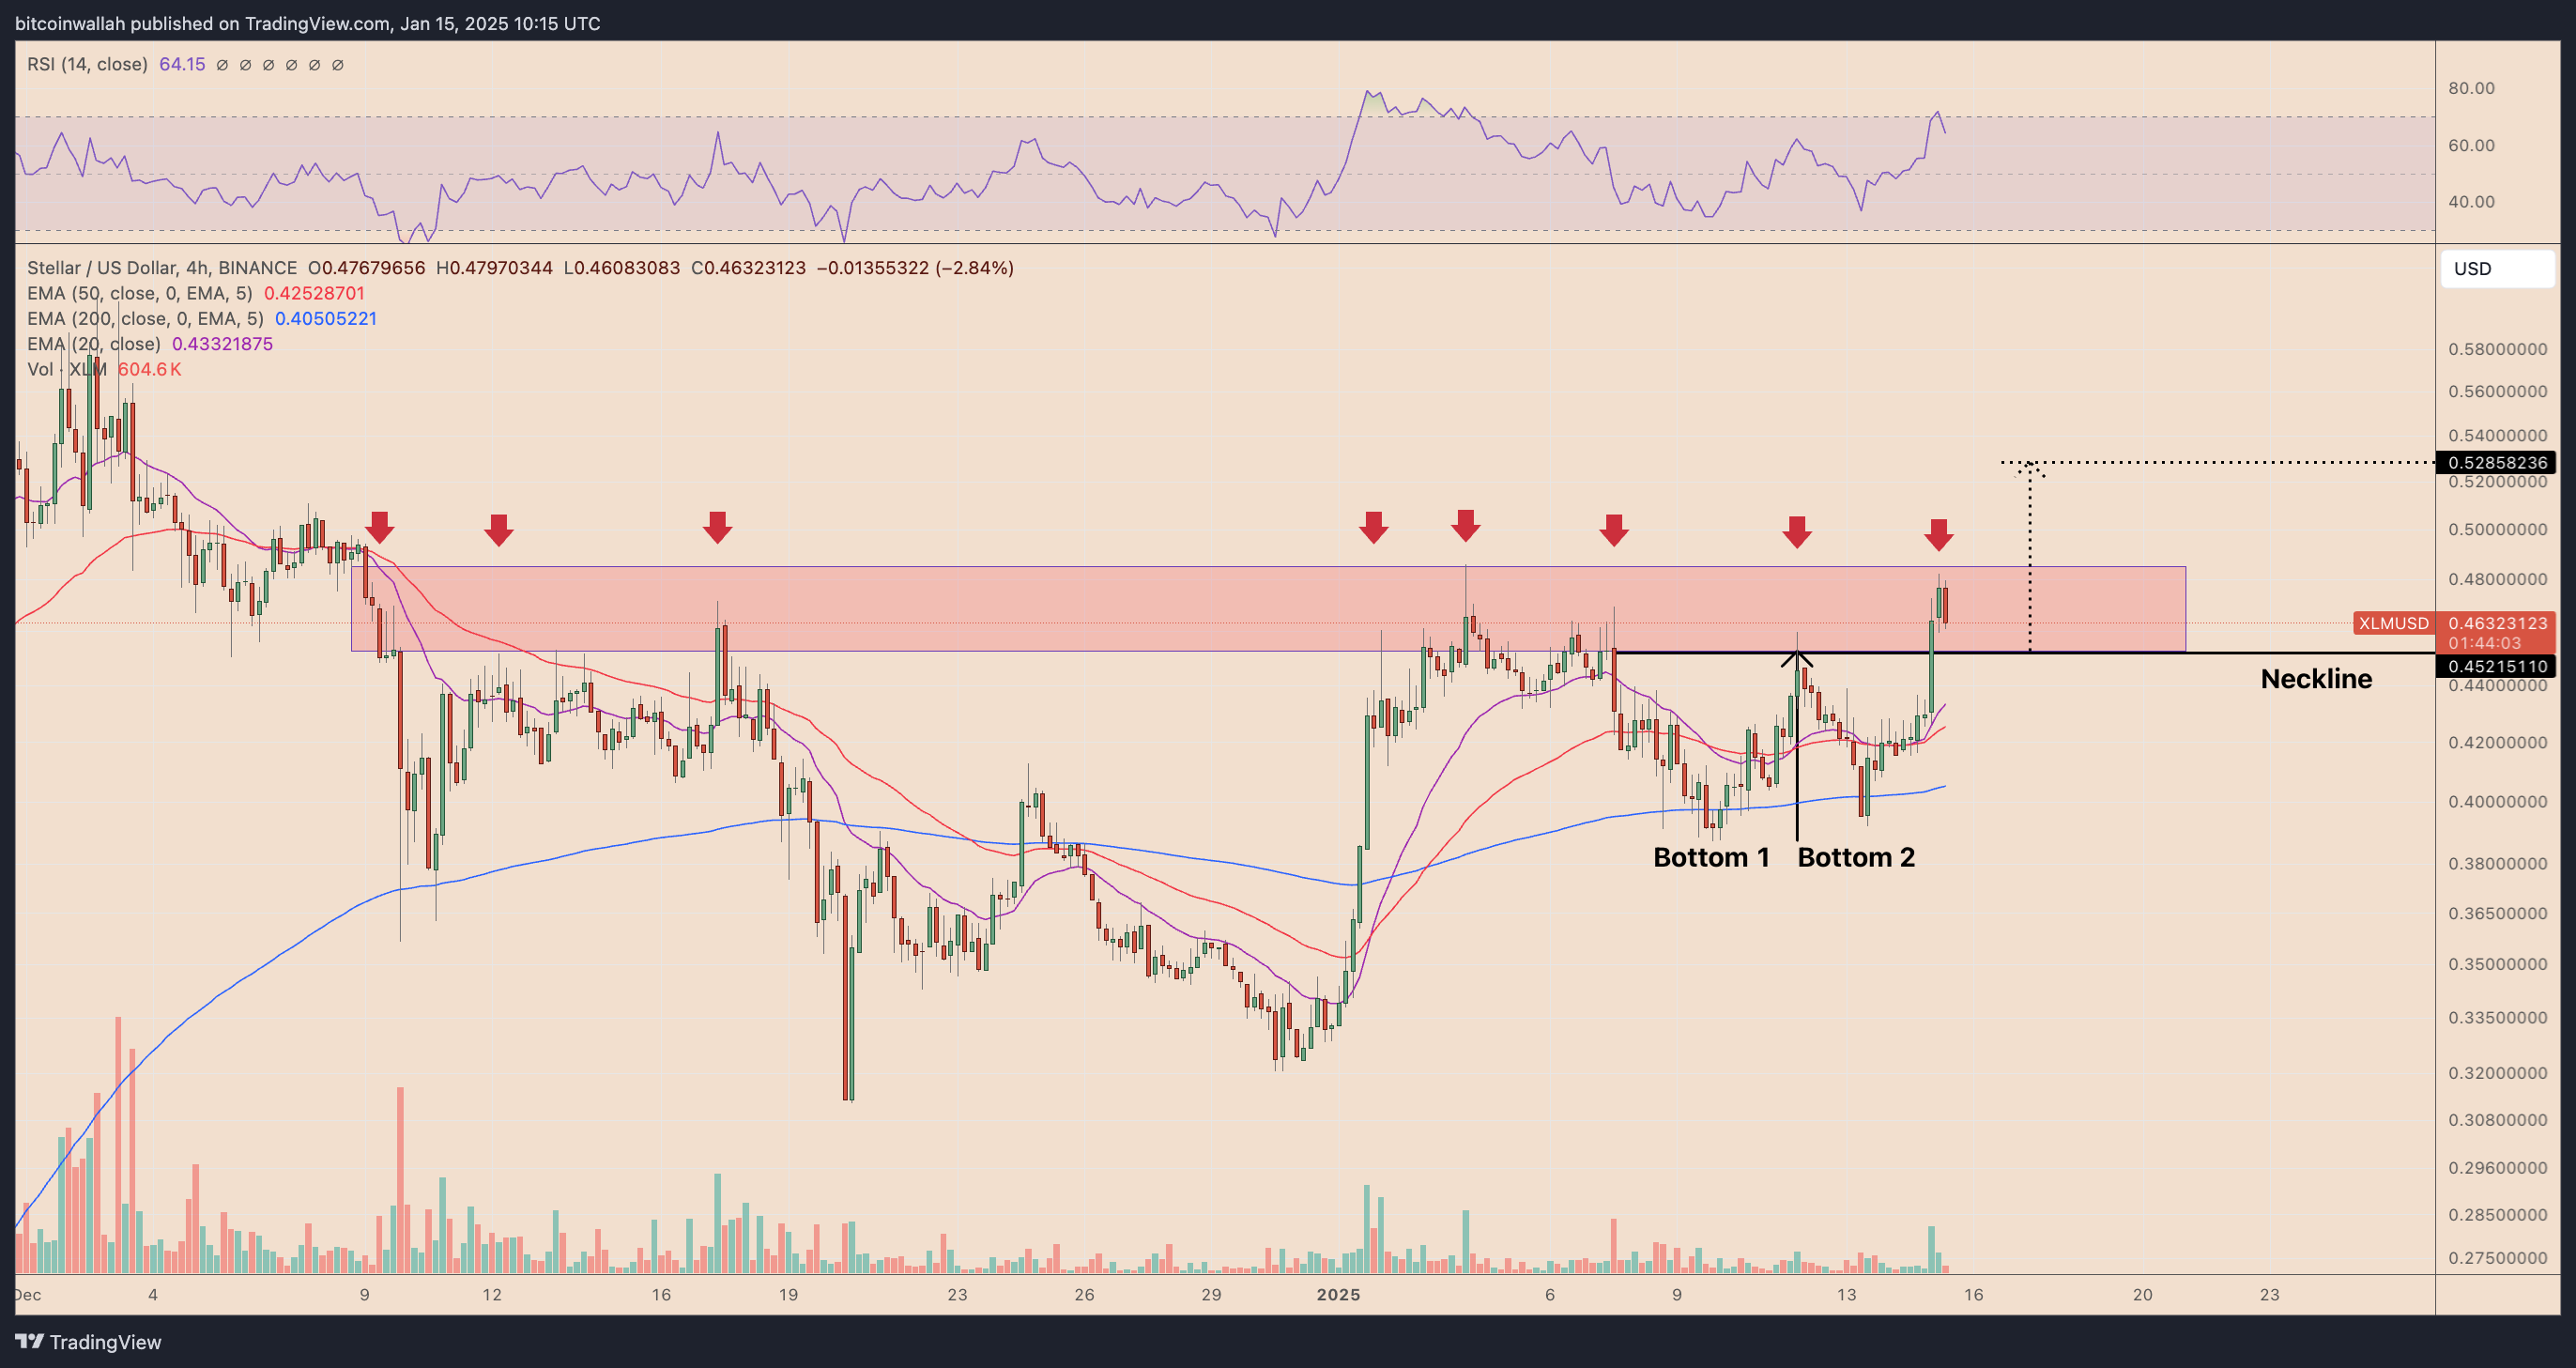
Stellar (XLM): Testing Critical Resistance
Stellar is attempting to breach the neckline of its double-bottom pattern near $0.48. A breakout here could propel XLM to $0.53, marking a 15% gain. On the weekly chart, however, XLM faces bearish pressure within a descending triangle, with potential downside to $0.33 if support fails. Conversely, a breakout above $0.47 would invalidate the bearish bias, potentially reigniting bullish momentum.
As ADA, HBAR, and XLM navigate critical technical thresholds, their price trajectories remain closely tied to market sentiment and macroeconomic conditions. Traders are advised to monitor key resistance and support levels to capitalize on potential moves in this volatile market.
Disclaimer: The information in this article is for general purposes only and does not constitute financial advice. The author’s views are personal and may not reflect the views of Chain Affairs. Before making any investment decisions, you should always conduct your own research. Chain Affairs is not responsible for any financial losses.
Also Read: Bitcoin Dips Below $90K: Fear or Opportunity? Crypto Market Divided
I’m a crypto enthusiast with a background in finance. I’m fascinated by the potential of crypto to disrupt traditional financial systems. I’m always on the lookout for new and innovative projects in the space. I believe that crypto has the potential to create a more equitable and inclusive financial system.